

Table of contents
Scores
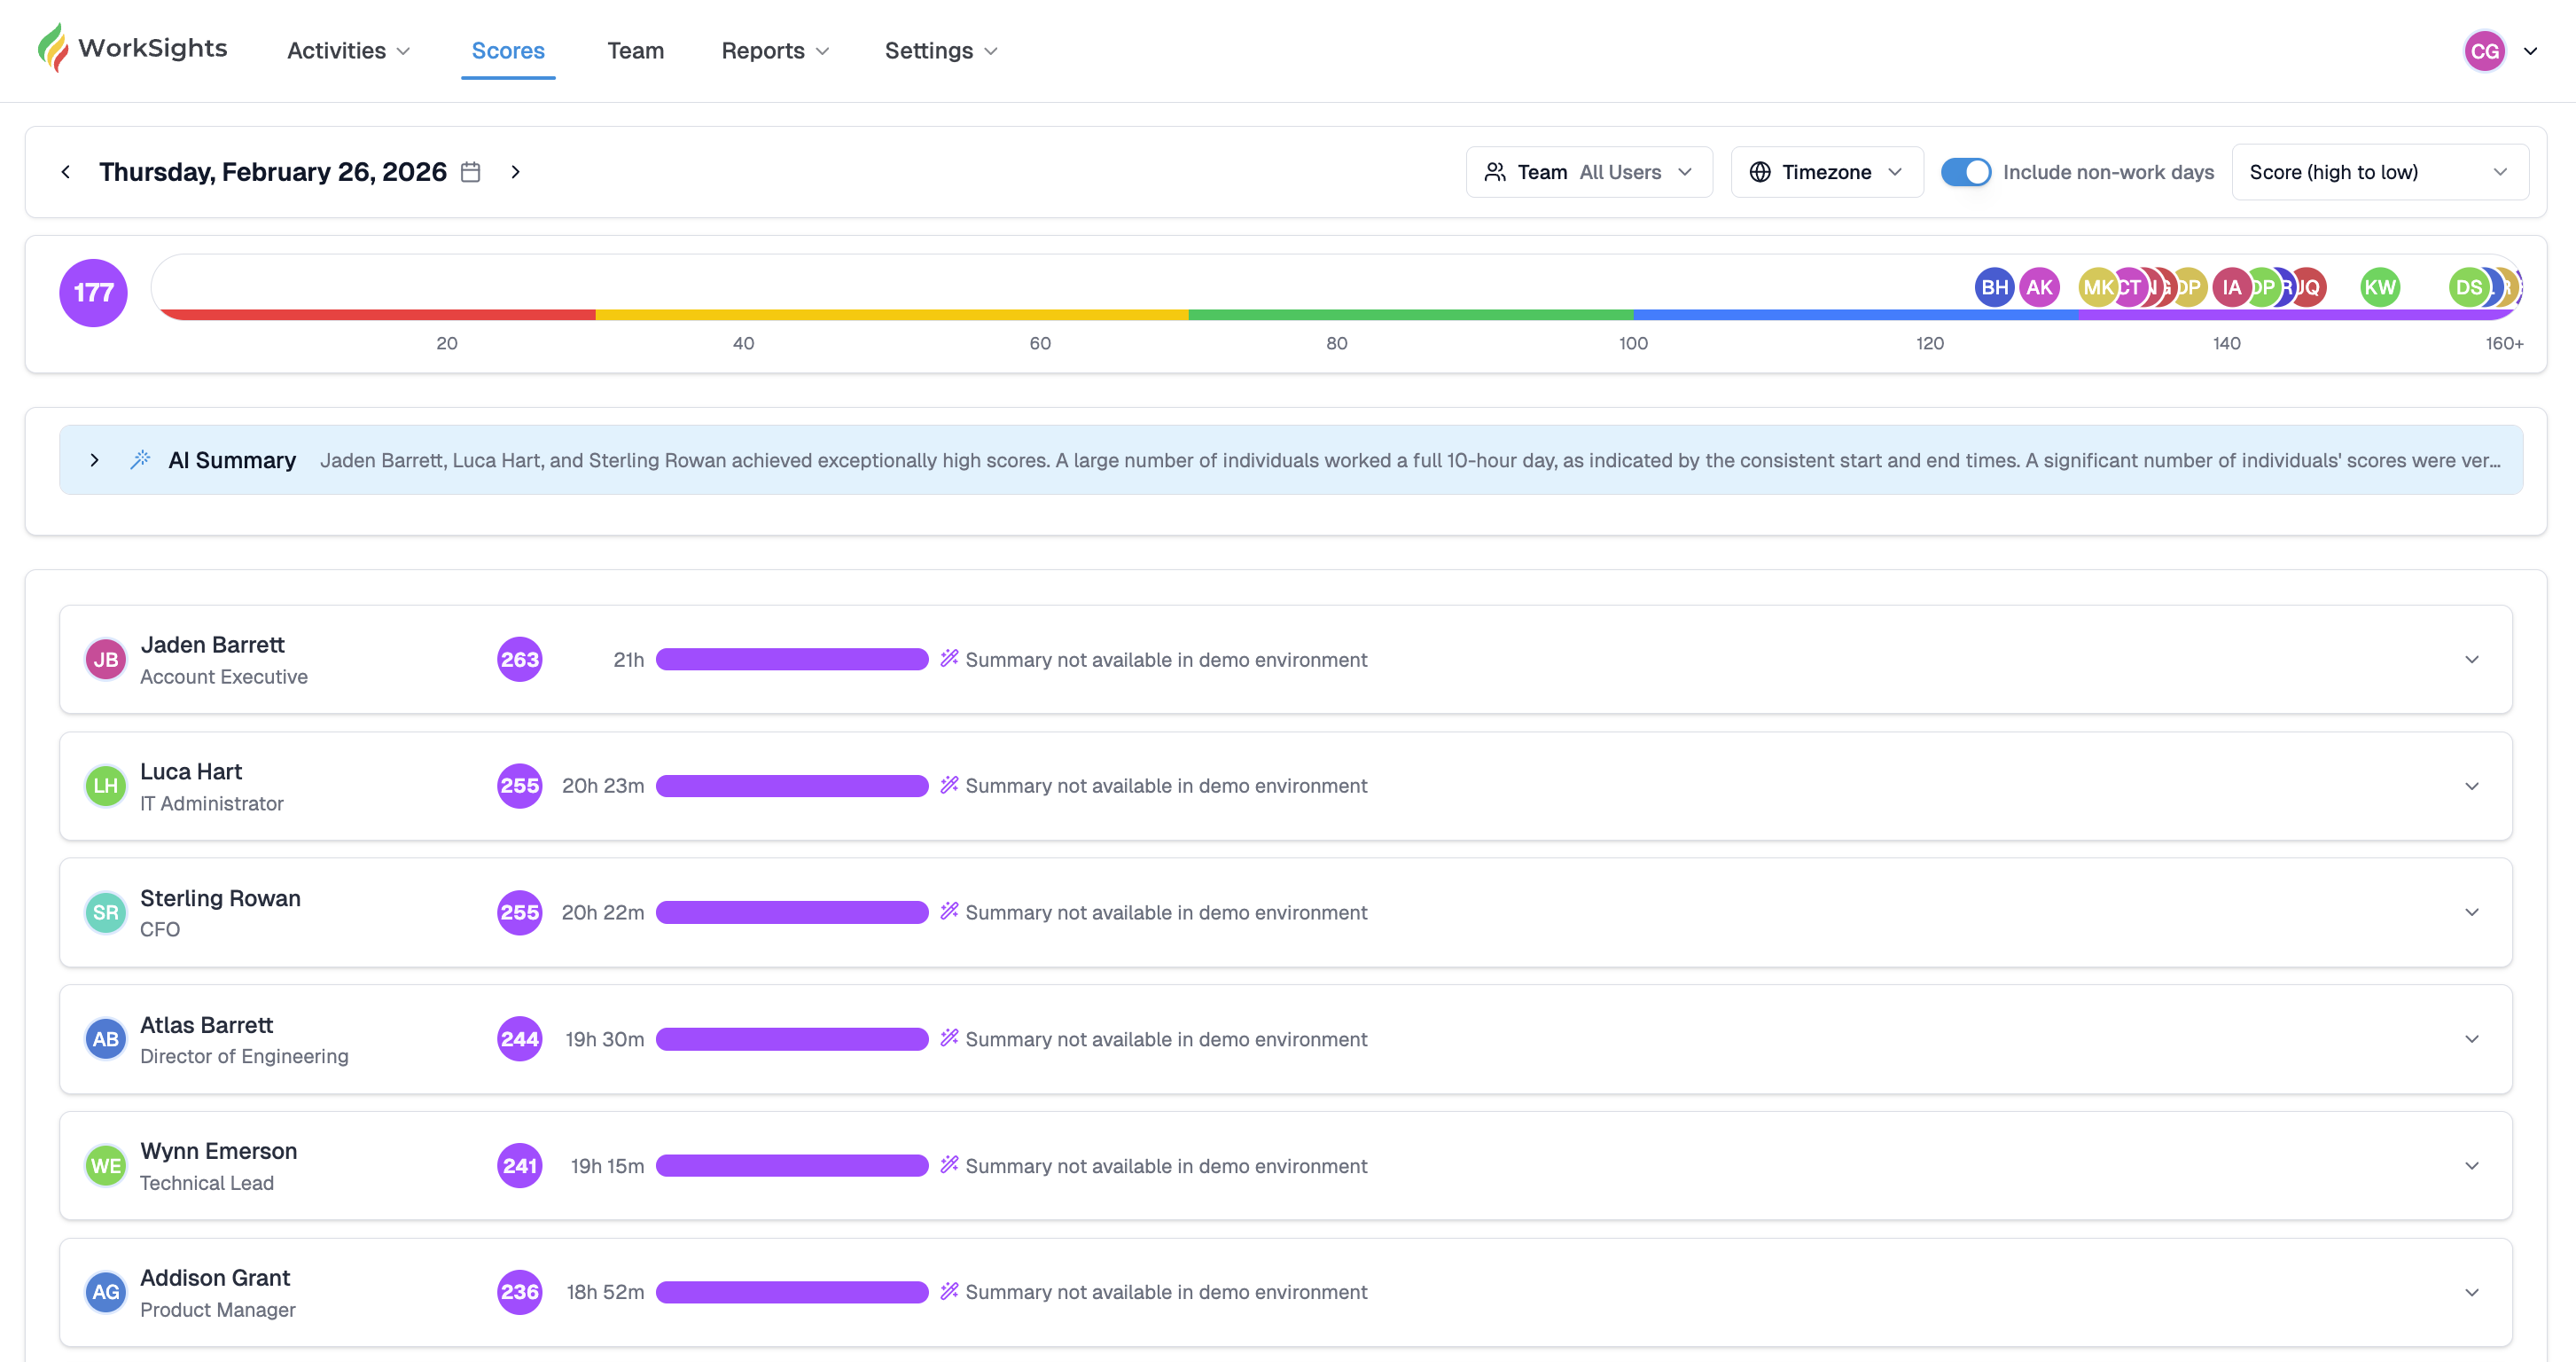
The Scores view provides a unified picture of how your team worked on a given day. It translates activity metadata from your connected services into a single, easy-to-interpret metric for each person and for the team as a whole. Scores help leaders understand daily patterns, identify exceptional workdays, and notice when systems or workflows may need attention.
Scores reflect work intensity relative to each user’s daily target. They do not reflect output volume or time tracking, but give you a high-level sense of how consistently your organization engages across tools throughout the day.
Team Score
At the top of the page, the colored bar represents your Team Score for the selected date. It aggregates all individual Scores into a single weighted benchmark of how active the organization was.
The bar’s color follows the same thresholds used across WorkSights:
🟥 Red (0 → 30) — very light activity or disconnected services
🟨 Yellow (31 → 70) — below target but still present
🟩 Green (71 → 100) — target achieved: steady, healthy workday
🟦 Blue (101 → 130) — above target, strong collaboration or longer hours
🟪 Purple (>131) — sustained high effort; intensity that may merit attention
AI Summary
Below the Team Score, WorkSights provides an AI Summary that highlights notable patterns for the day. This may include:
- Individuals with exceptionally high or low Scores
- Groups who worked similar hours or followed similar activity patterns
- Significant anomalies (for example, many users starting early or working late)
The summary focuses on organizational signals, giving leaders an immediate sense of how the day unfolded across the team.
Individual Scores
Each user’s Score appears as its own card. The card includes:
- The person’s name and role
- Their daily Score
- Total hours represented by their activity signals
- A color-coded bar reflecting their intensity level
- A generated AI daily summary, when available
These per-user summaries are narrative descriptions of the user’s day — for example:
“Began work around 8:45 AM with early commits to the repository. Logged multiple successful authentications, exchanged emails with internal and external participants, and continued collaborating on the ‘File Name’ well past 11:00 PM.”
Summaries highlight:
- When the person started and ended their active day
- Major clusters of collaboration
- Key services used
- Patterns such as early starts, late evenings, or sustained project work
Summaries do not reveal message content, file content, or sensitive personal information.
Viewing Options
The Scores page includes several controls to adjust how you view the day:
- Team/Individuals — switch between the aggregate Score and per-user list
- Timezone — align interpretation across regions
- Include non-work days — toggle weekends or custom off-days
- Sort — order individuals by Score, name, or role
These options help tailor the view to your team’s structure and working patterns.
How Scores Update
Scores refresh automatically once your connected services finish processing activity logs. Most systems complete this between 1:00 AM and 4:00 AM local time, ensuring that the Scores for each date include the full workday.
Interpreting Scores
Scores offer visibility into day-to-day engagement across tools.
Green days reflect stable, typical activity. Blue days often show extended collaboration or deadline-driven work. Purple days may indicate extraordinary effort, which is helpful to recognize and monitor. Red scores usually point to disconnected integrations, onboarding phases, or very light activity.
Summary
Scores offer a consistent, system-level view of daily activity by normalizing metadata signals from all connected services into a single intensity model. Team Score reflects the aggregate pattern for the day, while individual Scores and AI summaries surface the underlying distribution and event structure. This provides a reliable technical baseline for understanding how work unfolded without interpreting output or content.